This is the first follow-up to Friday’s release post and it covers the two changes from this release that affect how you iterate on a Codename One app rather than what the app itself does. On-device debugging that treats Java as Java on a real iPhone or a real Android device, and standard JUnit 5 against the JavaSE simulator. The first is the one we have been wanting for a long time, and is the one that takes the most explaining, so most of the post is about it.
On-device debugging that treats Java as Java
Codename One has always supported on-device debugging in the strict technical sense. You could attach Xcode to a .ipa, you could attach Android Studio to a running APK, you could read the native call stack, you could step through Objective-C or the C that ParparVM emits. What you could not do was set a breakpoint in MyForm.java, hit it on a real iPhone, and inspect a Java field on a Java object as a Java object. You also could not debug an iOS app without a Mac in the loop somewhere, because the only debugger that understood the binary was Xcode. The translation step between the Java you wrote and the C that ParparVM produces left no way back across the gap on the device.
PR #4999 (iOS) and PR #5012 (Android) close that gap. As of this week any JDWP-speaking debugger (IntelliJ IDEA, jdb, VS Code’s Java Debugger, Eclipse, NetBeans) can attach to a Codename One app and treat the running process as a JVM.
Supported targets:
iOS
- the iOS Simulator (requires a Mac, because the iOS Simulator only runs on a Mac),
- a real iPhone reached over Wi-Fi from the developer machine on the same network.
You do not need a local Mac to debug on a real iPhone. The Codename One build cloud runs the iOS build for you and produces a signed .ipa; install it on your iPhone the usual way (TestFlight, ad-hoc, or the standard Build Cloud install link), and the JDWP attach over Wi-Fi works from a Linux or Windows IDE just as well as from a Mac. The Mac is only required for the local Xcode build path and for running the iOS Simulator.
Android
- the Android emulator,
- a real Android phone over USB,
- a real Android phone over wireless
adb.
The Android attach uses standard adb, so you need the Android SDK platform tools installed on the developer machine. Those are available on macOS, Linux, and Windows, so any of the three is fine for Android debugging.
What it looks like
A breakpoint inside an iOS app, hit on the iOS Simulator next to IntelliJ IDEA:
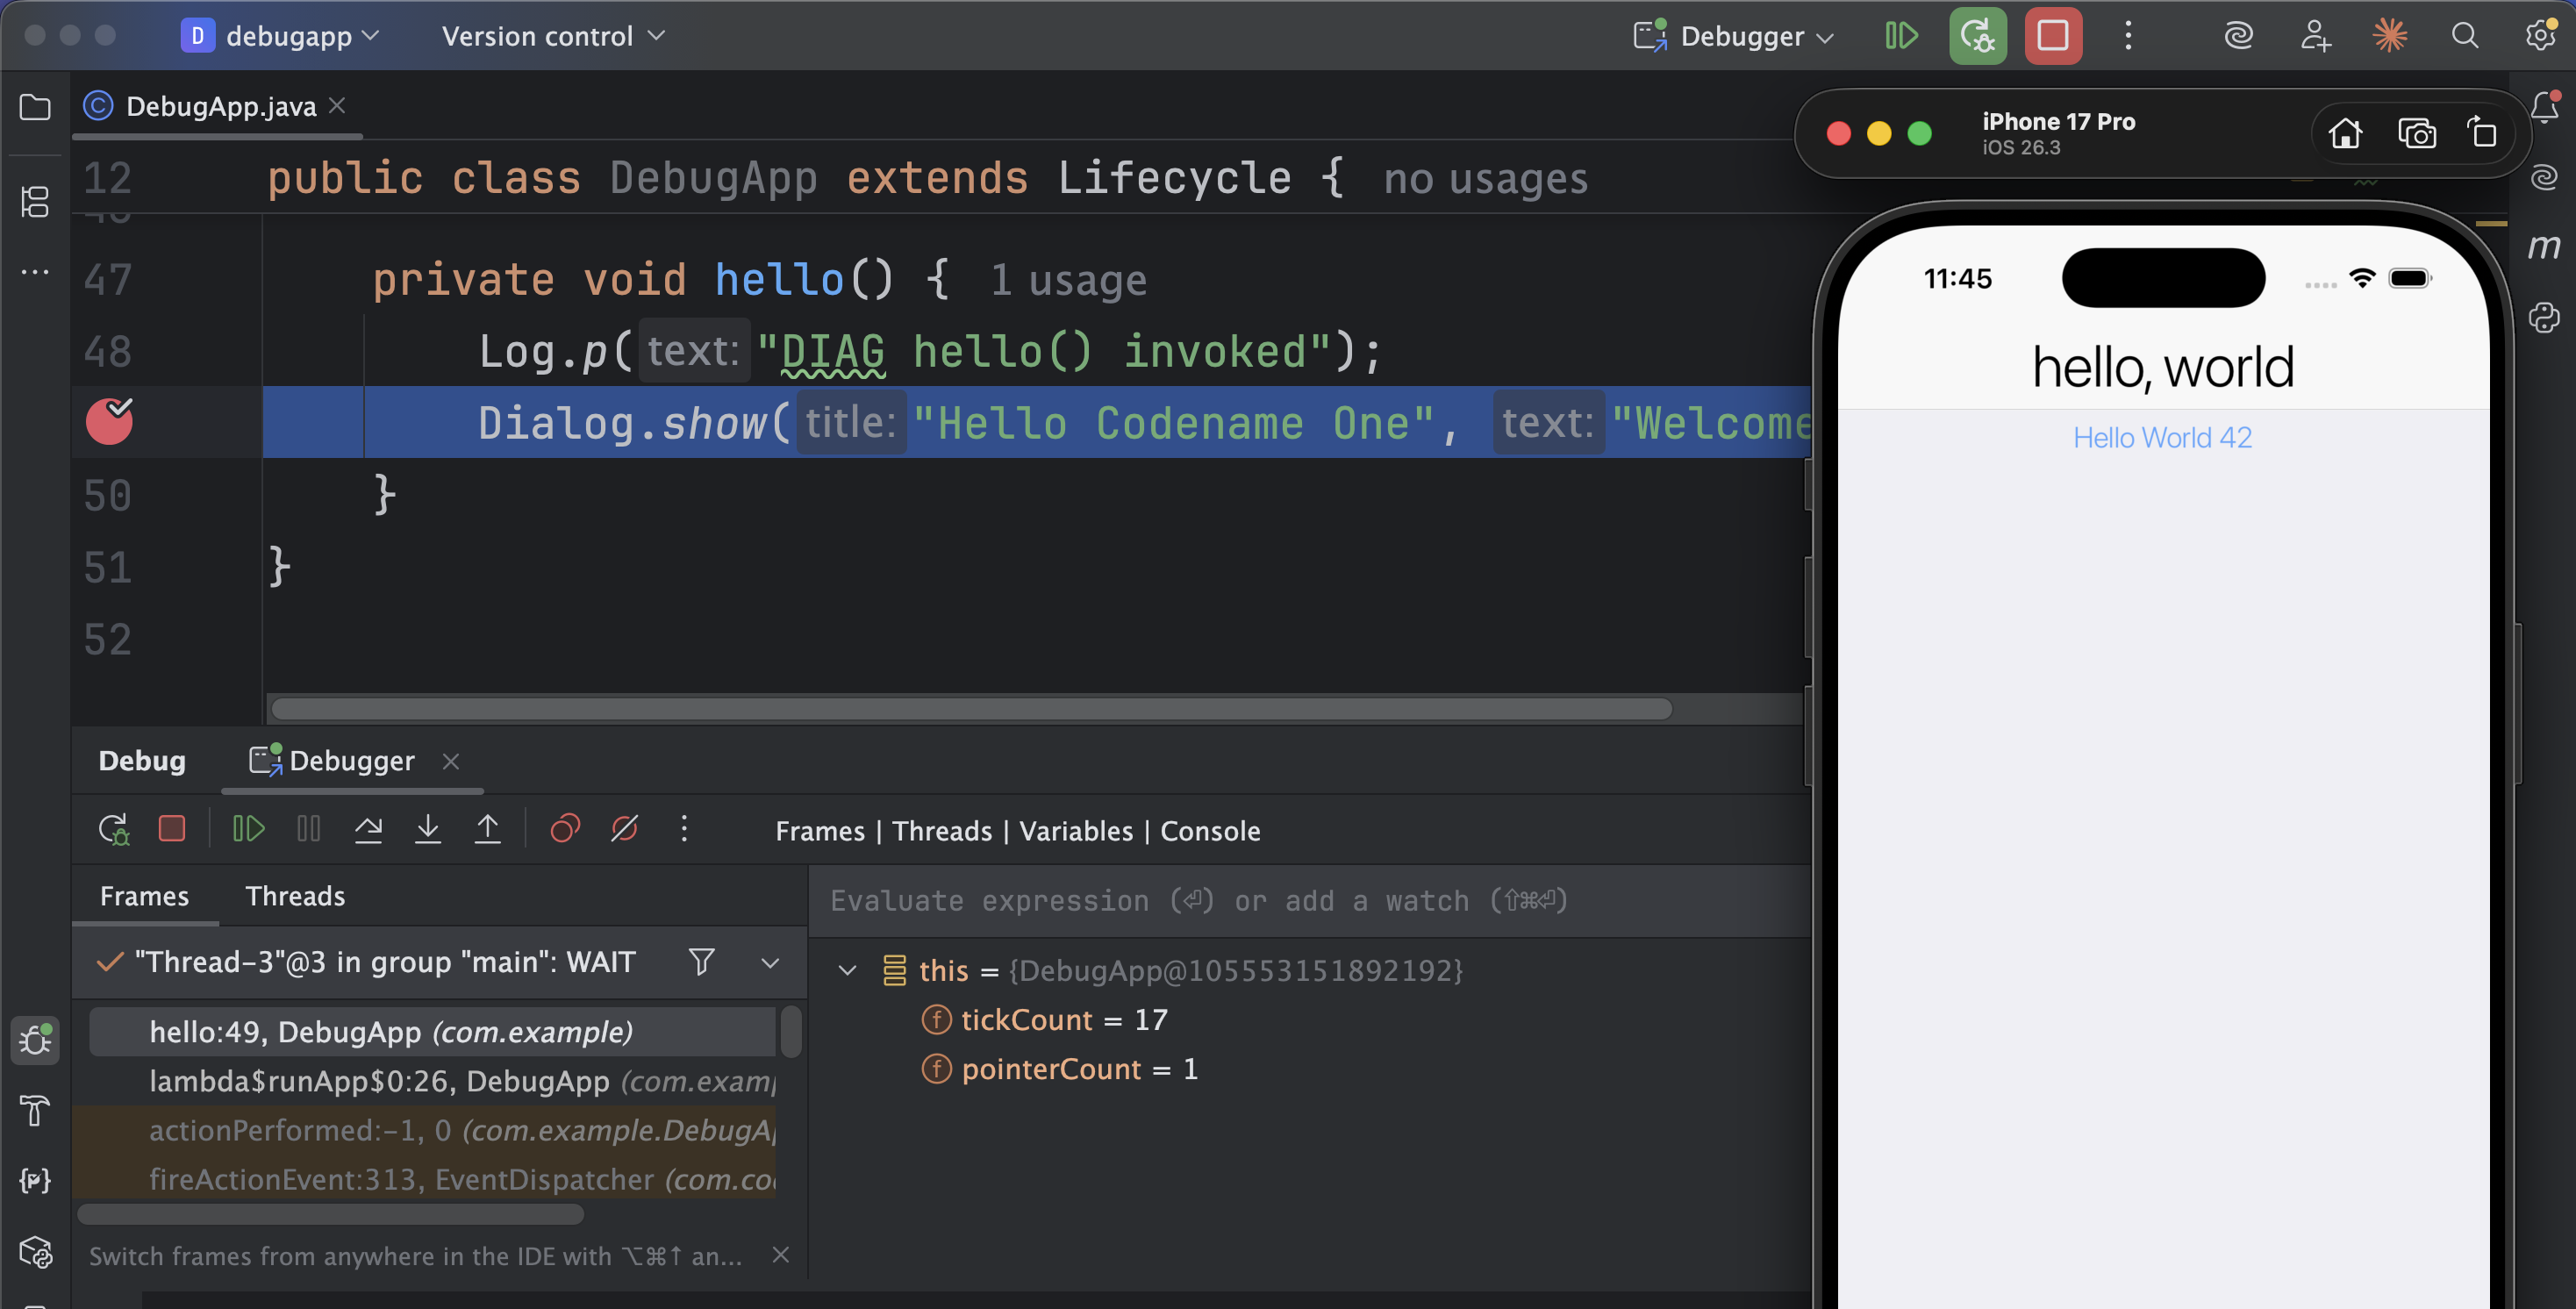
The same Debug tool window you use for any other Java project. Frames panel on the left has the full Java call stack. The Variables panel shows this and the locals as Java values, with the same drill-down you would get on a regular JVM. The simulator on the right is the real iOS app, paused at the breakpoint, waiting for the next step.
How the pieces fit together
On iOS the IDE never talks to the device directly. The CN1 Debug Proxy is a small Java process you run on your developer machine. It binds two TCP ports: one for the iOS app to dial into using the CN1 wire protocol, and one that speaks standard JDWP for the IDE. The IDE sees a normal remote JVM. The iOS app sees a debug proxy. The proxy translates between the two and walks the ParparVM struct layout so Java fields, method calls, and values round-trip cleanly in both directions.
any OS"] -- "JDWP
(localhost:8000)" --> Proxy["CN1 Debug Proxy
your dev machine"] Proxy -- "CN1 wire protocol
(Wi-Fi or loopback)" --> App["Codename One iOS app
real iPhone or iOS Simulator"]
On Android the proxy is unnecessary. Dalvik / ART implement JDWP themselves, so IntelliJ attaches directly to the device through adb’s built-in JDWP forwarder. The Maven plugin’s new cn1:android-on-device-debugging goal does the adb orchestration and the port forwarding for you.
macOS / Linux / Windows"] -- "JDWP
(localhost:5005)" --> ADB["adb forward
your dev machine"] ADB -- "JDWP over USB or Wi-Fi" --> Device["Android device
or emulator
Dalvik / ART"]
A capability difference between the two platforms worth knowing up front: on Android, a native interface’s Impl class is regular Java, so the JDWP attach steps through it the same way it steps through any other class in your project. On iOS the Impl is Objective-C, which JDWP does not speak, so you cannot step through it from the IDE. You can still step through the Codename One framework code and your own Java up to and through the native-interface call, and you can inspect the value the call returns; the body of the Objective-C method is the only thing that is opaque from the JDWP side. Attach Xcode in parallel if you need to step through the Objective-C as well.
Tutorial: IntelliJ + iOS
The Codename One archetype now generates two run configurations under an On-Device Debug folder in the IntelliJ run-config dropdown: CN1 Debug Proxy and CN1 Attach iOS. The tutorial below assumes a project generated from the Initializr recently enough to have those. If you have an older project, the iOS on-device debugging chapter of the developer guide has the run-configuration XML to drop into .idea/runConfigurations/.
1. Enable the build hints.
Open common/codenameone_settings.properties and uncomment the four lines the archetype generated:
ios.onDeviceDebug=true
ios.onDeviceDebug.proxyHost=127.0.0.1
ios.onDeviceDebug.proxyPort=55333
ios.onDeviceDebug.waitForAttach=true
ios.onDeviceDebug=true flips the iOS build into the instrumented variant. The other three configure the proxy connection.
The fourth hint, ios.onDeviceDebug.waitForAttach=true, is the block-on-load option, and we recommend leaving it on. With it enabled, the iOS app shows a “Waiting for debugger” overlay at launch and does not progress past Display.init until the proxy issues its first resume. The recommendation is mostly about making the on-device-debug variant visible. Without the overlay it is easy to launch an on-device-debug build expecting the debugger to attach and not realise it is silently waiting for a proxy that is not running, and it is also easy to mistake an on-device-debug build for a regular build and then be surprised when it does not perform as smoothly as the release variant. The overlay rules out both of those.
For a physical iPhone the proxyHost value should be the laptop’s LAN IP (run ifconfig | grep "inet " to find it) rather than 127.0.0.1. The iOS Simulator can always use 127.0.0.1.
2. Build the iOS app.
Either path works:
- Local Xcode build (
mvn cn1:buildIosXcodeProject) and then run from Xcode. - Cloud build for a real device (
mvn cn1:buildIosOnDeviceDebug) and install the resulting.ipa.
Both produce an iOS binary instrumented for on-device debugging because the build hint is set.
3. Start the proxy.
In IntelliJ, pick CN1 Debug Proxy from the run-config dropdown and click the green ▶ Run button (not the bug icon; Debug on this config would attach IntelliJ to the proxy itself, which is not what you want). The Run tool window shows:
On-device-debug proxy starting:
  symbols : .../cn1-symbols.txt
  device  : listening on tcp://0.0.0.0:55333
  jdwp    : listening on tcp://0.0.0.0:8000
[device] listening on port 55333 for ParparVM app to dial in
[jdwp]   listening on port 8000 for debugger (jdb) to attach
When the [jdwp] line appears, the proxy is ready.
4. Attach the debugger.
Switch the run-config dropdown to CN1 Attach iOS and click the 🐞 Debug button. IntelliJ connects to localhost:8000 and opens its standard Debug tool window. You can now set breakpoints anywhere in your Java code or in the framework.
5. Launch the app.
Launch the iOS app under the iOS Simulator (from Xcode) or on the tethered device. With waitForAttach=true it pauses at the “Waiting for debugger” overlay until the proxy issues its first resume. Hit Resume on the IntelliJ Debug toolbar; the app proceeds, your breakpoints fire as the app exercises them.
The proxy’s Run window is also your device console. Anything the app writes to System.out, Log.p, printf, or NSLog from native code is forwarded to the proxy and printed in the CN1 Debug Proxy Run window with a [device] prefix. This is genuinely useful and is one fewer thing you need Xcode for. The caveat is that the forwarding starts when the proxy connection is established, so output written during the very first millisecond of process launch (before Display.init) is not always captured. If you need every byte from t=0, attach Xcode’s console for that specific run.
Tutorial: IntelliJ + Android
Android is simpler because the proxy is not needed. The archetype generates two run configurations under the same On-Device Debug folder: CN1 Android On-Device Debug (Maven, builds and installs the APK and forwards JDWP) and CN1 Attach Android (Remote JVM Debug at localhost:5005).
1. Enable the build hint.
In common/codenameone_settings.properties:
android.onDeviceDebug=true
This single hint flips the manifest to debuggable="true" and turns R8 / Proguard off for this build. Release builds without the hint are unaffected.
2. Run CN1 Android On-Device Debug.
Picks up the hint, builds the APK, installs it on the connected device or emulator, sets the debug-app for wait-for-attach, launches the Activity, forwards JDWP to localhost:5005, and streams logcat --pid=<pid> into the Run window with a [device] prefix.
For wireless adb, pass -Dcn1.android.onDeviceDebug.wireless=<ip:port> and the goal will adb connect before installing. Both the Android 11+ adb pair flow and the legacy adb tcpip flow work.
3. Attach the debugger.
Switch to CN1 Attach Android and click 🐞 Debug. IntelliJ connects to localhost:5005. Set breakpoints anywhere; they fire when exercised.
Source resolution covers both the codenameone-core and codenameone-android sources jars, so breakpoints inside the framework or inside the Android port resolve to the right files. On Android, native interfaces are themselves Java, so a breakpoint inside the Impl class of your own native interface fires just like a breakpoint anywhere else in your code; you can step through the implementation, inspect locals, and evaluate expressions the same way.
The dev guide has the full reference, including the wireless-pairing flows, the VS Code and Eclipse equivalents, and a troubleshooting section: iOS on-device debugging and Android on-device debugging.
When to use it (and when not to)
For most bugs the JavaSE simulator is still by a large margin the fastest loop. Reach for on-device debugging when the bug is platform-specific: ParparVM-specific threading, an iOS-only layout glitch under the modern native theme, a real-radio Bluetooth interaction, a Touch ID gate, an Android-only manifest interaction, anything that only reproduces under iOS background memory pressure. The kind of bug that previously sent you reaching for Log.p and a rebuild loop. That bug now has a debugger pointed at it.
JUnit 5 against the simulator
The other change in this release is the new JUnit 5 integration in the JavaSE port (PR #5032).
To be clear about what this is: it is standard JUnit 5. There is no fork of JUnit in com.codename1.testing.junit. That package holds a small set of annotations and a CodenameOneExtension that plugs into the regular JUnit Jupiter lifecycle. You write @Test methods using org.junit.jupiter.api.Test, you assert with org.junit.jupiter.api.Assertions, and your IDE’s native test runner picks them up the way it does on any other Java project.
Why a separate integration at all? The legacy com.codename1.testing.AbstractTest framework, driven by the cn1:test Maven goal, still exists and is still the only way to run tests on a real iOS or Android device (JUnit Jupiter is not available on ParparVM). The trade-off is that AbstractTest tests have to compile under the Codename One device subset, with no reflection, no java.net.http, no java.nio.file, no Mockito, no AssertJ, no assertThrows. JUnit-style tests run only on the JavaSE simulator JVM, but the JVM is a regular JVM, so reflection, Mockito, AssertJ, and parameterised tests are all available.
Both styles coexist in the same project under common/src/test/java. You pick per test class. The runners discover disjoint sets (cn1:test looks for UnitTest implementers; Surefire looks for @Test methods), so a mvn install runs both passes in the same phase without overlap.
A minimal test
Tests live in common/src/test/java. The shape most apps want is one that boots the project’s app class through the same init / start sequence the simulator uses, then asserts against the form the app actually opens:
package com.example.myapp;

import com.codename1.testing.junit.CodenameOneTest;
import com.codename1.testing.junit.RunOnEdt;
import com.codename1.ui.CN;
import com.codename1.ui.Display;
import com.codename1.ui.Form;
import org.junit.jupiter.api.Test;
import static org.junit.jupiter.api.Assertions.assertEquals;
import static org.junit.jupiter.api.Assertions.assertTrue;

@CodenameOneTest
class GreetingFormTest {

    @Test
    @RunOnEdt
    void formShowsExpectedTitle() {
        MyAppName app = new MyAppName();
        app.init(null);
        app.start();

        assertEquals("Hi World", Display.getInstance().getCurrent().getTitle());
        assertTrue(CN.isEdt(), "@RunOnEdt method runs on the Codename One EDT");
    }
}
That is more useful than constructing a Form directly in the test because it exercises the same startup path the simulator runs. The assertions check the form your app opens, not a form the test wrote.
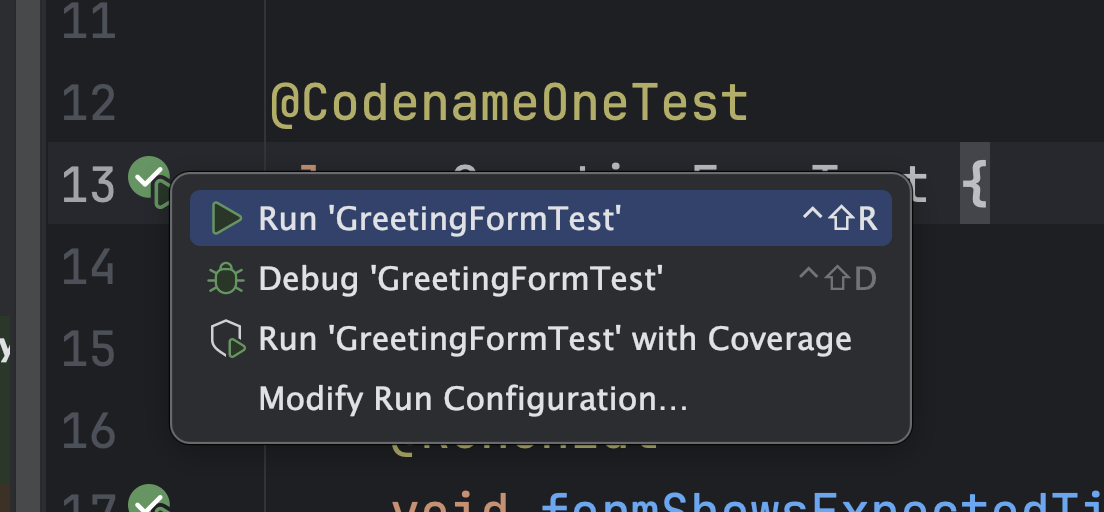
The natural way to run it is from the IntelliJ gutter. Click the green ▶ icon next to the class declaration:
The results land in the standard Run tool window:
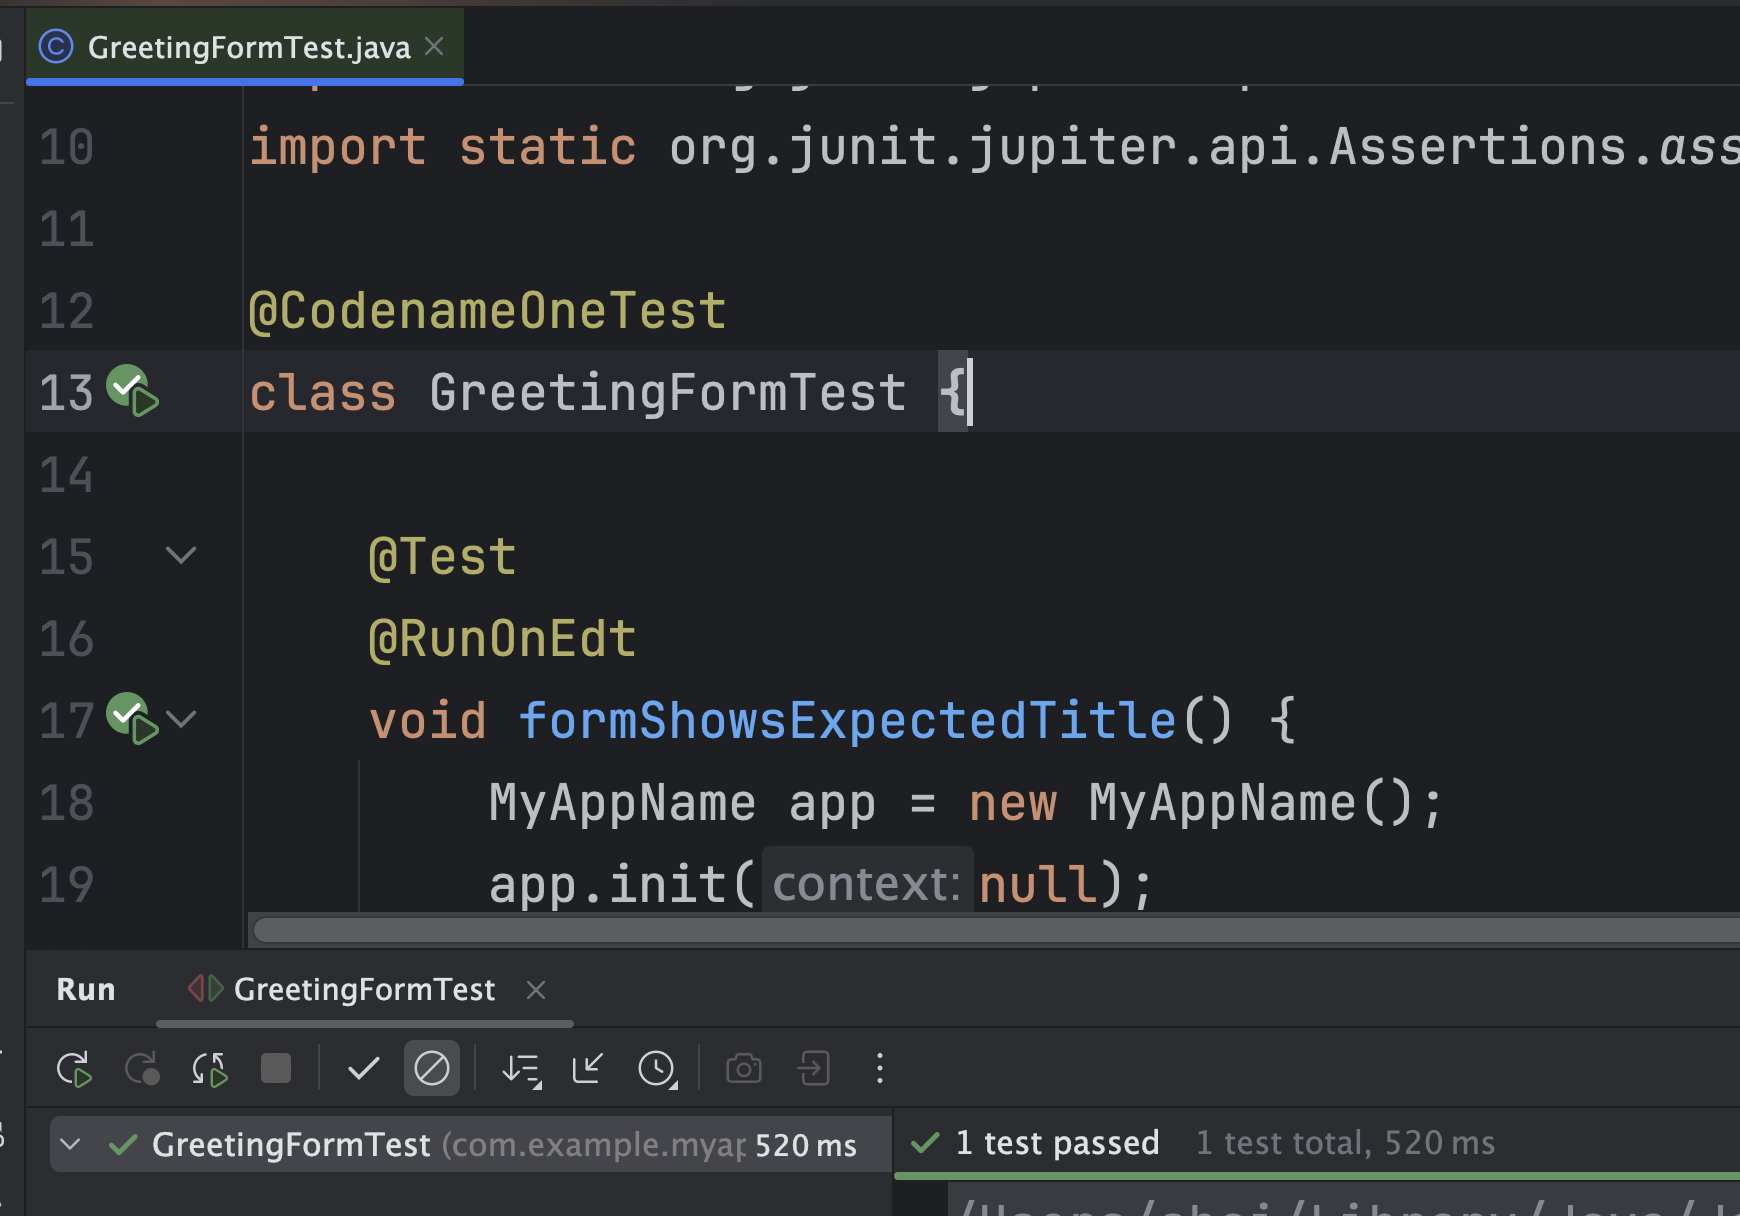
Click the green icon next to a specific @Test method to run just that method. The same flow works in VS Code’s Test Explorer and in Eclipse’s JUnit view.
If you prefer the command line:
mvn -Ptest test                                  # run the JUnit suite
mvn -Ptest test -Dtest=GreetingFormTest          # one class
mvn -Ptest test -Dtest=GreetingFormTest#formShowsExpectedTitle
@CodenameOneTest is the class-level entry point. It wires the simulator extension into the JUnit Jupiter lifecycle, boots Display.init(null) once per JVM (idempotent, so subsequent classes share the same Display), and skips the class with a TestAbortedException if the JVM is genuinely headless (so CI runners that have no display do not poison the rest of the run).
@RunOnEdt dispatches the test body through CN.callSerially, which is what you want any time the body touches UI state. It rethrows the body’s exceptions on the JUnit thread so the stack trace stays clickable in the IDE. Place it on the method for one test, on the class to apply to every test.
A couple more common cases
A test that exercises a plain validator, with no UI involved at all:
@CodenameOneTest
class EmailValidatorTest {

    @Test
    void rejectsEmptyString() {
        assertFalse(new EmailValidator().isValid(""));
    }

    @Test
    void acceptsCommonAddress() {
        assertTrue(new EmailValidator().isValid("name@example.com"));
    }
}
This is the “pure model code” shape. No @RunOnEdt, no UI, runs on the JUnit worker thread, fast.
A test of a form under a specific visual configuration:
@CodenameOneTest
class GreetingFormVisualTest {

    @Test
    @RunOnEdt
    @DarkMode
    @LargerText(scale = 1.6f)
    void titleStillFitsInDarkModeAtAccessibilityScale() {
        new GreetingForm().show();

        Form current = Display.getInstance().getCurrent();
        assertEquals("Hello", current.getTitle());
        assertTrue(current.getPreferredW() <= Display.getInstance().getDisplayWidth());
    }
}
The visual-config annotations (@Theme, @DarkMode, @LargerText, @Orientation, @RTL) apply on the EDT in one batch, followed by a single theme refresh, so the test body sees the simulator in the exact configuration you asked for without flicker.
A test that injects a custom property for the duration of one method:
@Test
@RunOnEdt
@SimulatorProperty(name = "feature.flag", value = "on")
void newCodePathRunsWhenFlagIsOn() {
    // Display.getProperty("feature.flag", "off") returns "on" here
    runFeature();
    assertEquals("expected", Display.getInstance().getCurrent().getTitle());
}
Class-level @SimulatorProperty applies to every method in the class. Method-level overrides class-level. Use the container @SimulatorProperties for more than one (the package source level rules out @Repeatable).
The full reference, including the dependency-block YAML for common/pom.xml and javase/pom.xml and the @Theme / @Orientation / @RTL details, is at Testing with JUnit 5 in the developer guide.
Wrapping up
That is the workflow half of this release. Monday’s post covers the new platform APIs that moved into the core this week: AI and OAuth / OIDC are the headline pieces, with WiFi / connectivity and a few smaller items alongside them.
Back to the weekly index.
Discussion
Join the conversation via GitHub Discussions.